

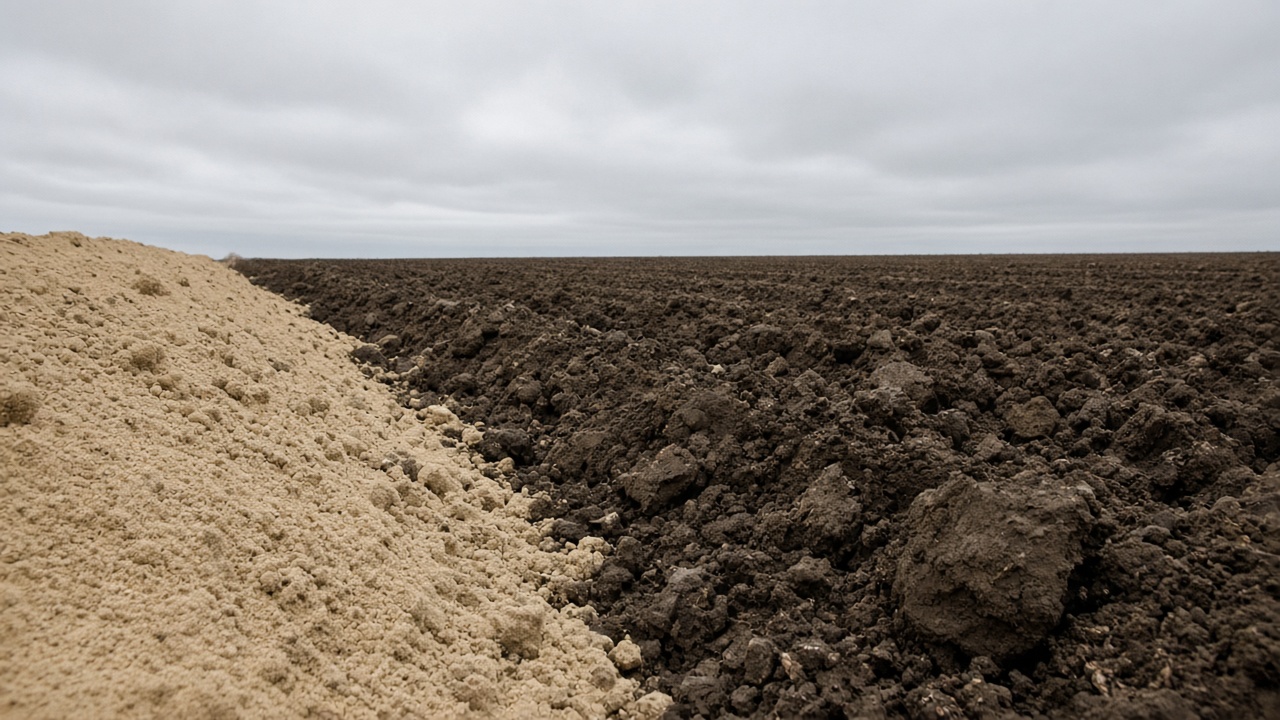
A field boundary is a legal and practical line. Inside it, the ground is rarely one thing. Texture changes. Water moves to the low spots and runs off the knobs. The crop grows differently on a north slope than on a south slope, and differently over an old fenceline than over the rest of the acre. Variable rate application exists because of that unevenness. The rate changes because the field does.
The unevenness has a name in agronomy: spatial variability. It means a property of the field, measured at two places, is not the same. The property might be clay content, soil pH, organic matter, yield, or how green the canopy was in July.
Soil and water
Texture is the mix of sand, silt, and clay. Sandy ground holds less water and less nutrient against leaching. Clay holds more of both and can stay wet. Organic matter tracks with water-holding and with how much nitrogen the soil can supply on its own. These are not evenly painted. A single Corn Belt field often crosses two or three soil map units, and inside a map unit the texture still drifts.
Water follows gravity and the pores in the soil. Hilltops and side slopes shed water. Foot slopes and flats collect it. In a wet year the low ground can be the weak ground. In a dry year it can be the ground that still has moisture. A tile line changes that pattern again, drying a strip that used to pond. None of this is a rate. It is why a single rate is an average of unlike acres.
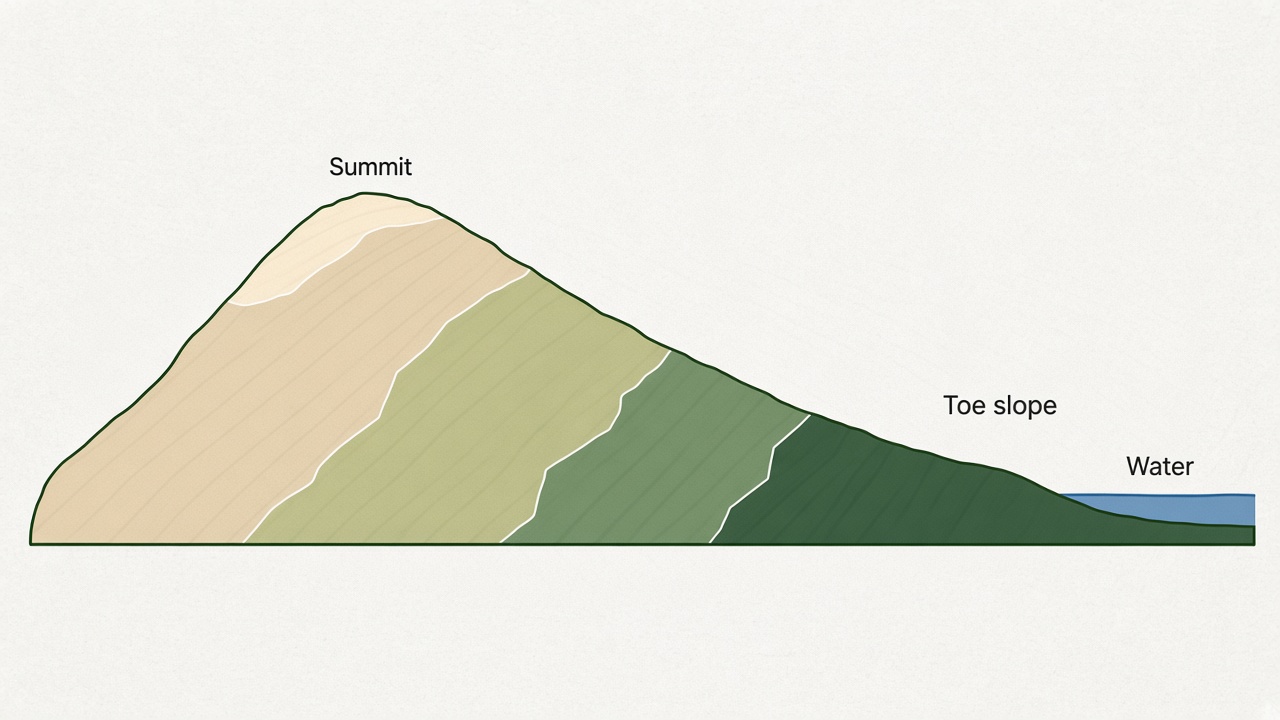
Slope, aspect, and history
Slope is the steepness. Aspect is the direction the slope faces. A steeper slope erodes, loses topsoil, and dries faster. A north-facing slope in the northern United States warms later in the spring than a south-facing one. Elevation maps and hillshades make those shapes visible even when the crop is hiding them.
History is written into the field too. An old homestead, a demolished fence, a filled ditch, years of manure beside a barn, or compaction from a traffic lane can all show up in yield and in the canopy long after the cause is gone. Soil surveys, slope maps, and conductivity maps pick up different parts of this. A yield map picks up the result at harvest. A canopy image picks up the result mid-season.
Variation is not a prescription
Seeing that a field varies does not decide a product rate. It explains why maps of the field are not one color, and why management zones and sample grids are drawn at all. The size of the difference matters as much as the fact of it. A field that is nearly uniform has little for a variable rate to follow. A field with a sand ridge, a wet swale, and a deep toe slope has a pattern that shows up in almost every layer.