

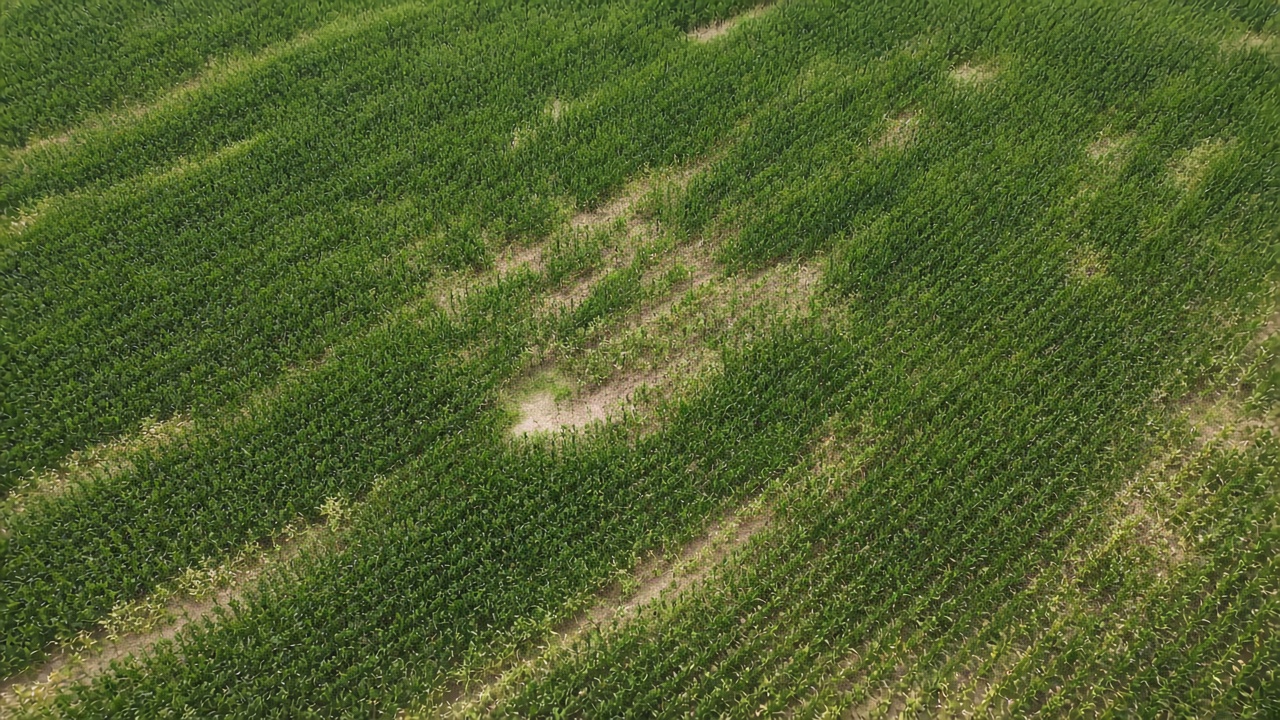
A vegetation index is a number made from reflected light. Green plants absorb much of the red light that hits them and reflect much of the near-infrared light. Bare soil and dead residue do not split those two bands the same way. An index turns that split into a single value so a whole field can be compared, cell by cell, from a satellite or from a sensor on a boom.
The number is not yield, and it is not a nutrient concentration. It is a description of the canopy that was in view when the light was measured: how much leaf was there, and how actively it was reflecting. People use it as a stand-in for how the crop was growing at that moment.
NDVI and its neighbors
The index used most often is NDVI, the normalized difference vegetation index. It is (near infrared minus red) divided by (near infrared plus red). The result runs from about -1 to 1. Water and bare ground sit low. A dense green canopy sits high, often well above 0.5 and, at full cover, close to 0.8 or more.
NDVI flattens when the canopy closes. Late in a corn year, a strong acre and a slightly less strong acre can both read as "very green," because the sensor mostly sees leaves either way. Other indexes stay sensitive longer. NDRE uses the red edge, a narrow band between red and near infrared, and is one of the indexes chosen for dense canopy. EVI, the enhanced vegetation index, is built to be less jumpy over bright soil and in haze. A map labeled only "imagery" or "vegetation" is one of these, or a close relative. The color scale is a choice of the software. The underlying number is the index.
Where the light comes from
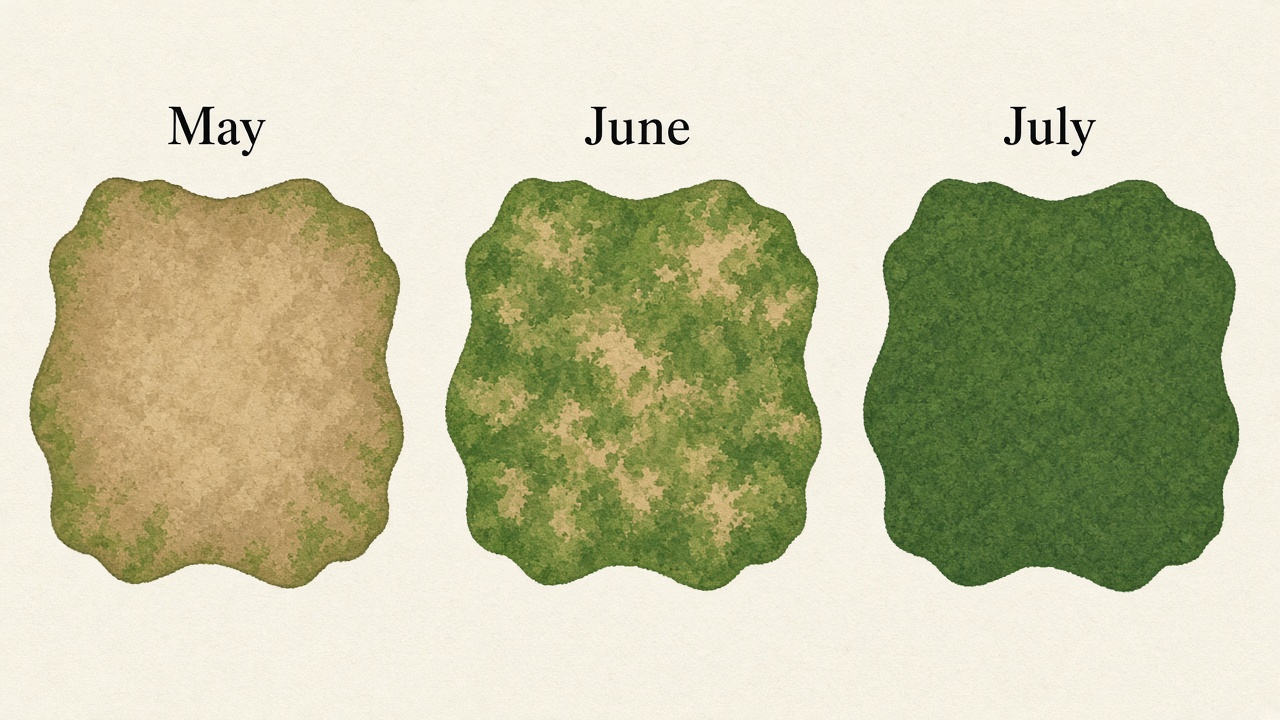
Satellites such as Sentinel-2 measure reflected sunlight. A cloud, a cloud shadow, or a wet soil surface changes the number without any change in the crop. A useful image is one with a clear view, taken when the crop is actually growing. Several years of those clear dates show which parts of the field are usually ahead or behind, which is a different fact from a single afternoon.
Active sensors on a nitrogen toolbar do not use sunlight. They shine their own light and read the return, so they can run at night and under cloud. That reading is what sensor-based variable rate follows during the pass. A satellite index is a picture from a day in the past. A boom sensor is a picture of the crop under the machine.
What an index leaves out
The canopy can look strong for reasons that are not a lasting property of the acre, including a head start on planting date, a different hybrid, or a streak of extra nitrogen. It can look weak because of a drown-out, a spray overlap, or hail. Read against a yield map and against soil and slope, the index is one more layer. Read alone, it is a photograph of growth, reduced to a number.