

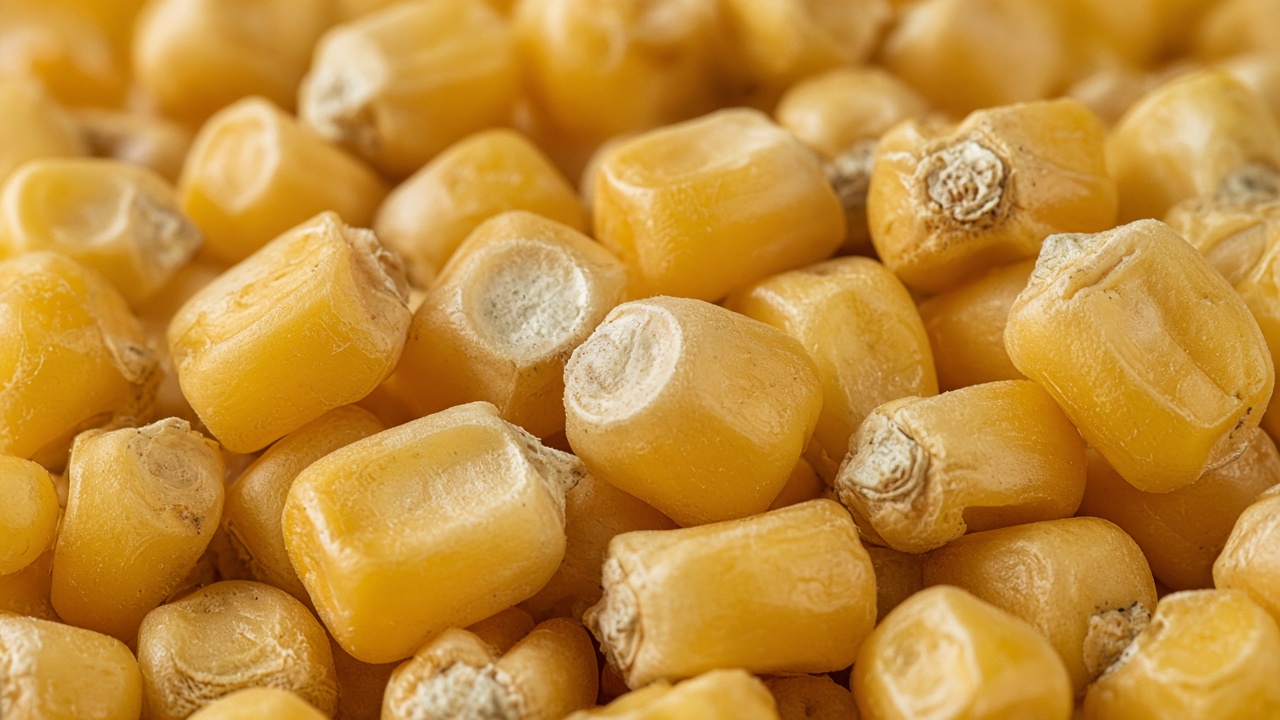
A yield monitor is the instrument on a combine or a forage harvester that estimates how much crop is coming in, and tags that estimate with a location. A yield map is the picture made from those estimates. It shows, after the fact, where the field yielded more and where it yielded less.
The monitor does not weigh the whole field in one act. It samples a flow. On a grain combine, a sensor in the clean grain path estimates the mass of grain going by. A moisture sensor corrects that mass to a dry-grain basis. GPS provides the position. Speed and swath width turn the flow into a yield per acre. A point is written every second or so. The map is those points, or a grid summarized from them.
What the points include besides yield
Grain does not reach the sensor at the moment it enters the head. It travels through the machine, and that delay shifts the point along the pass unless the software accounts for it. Turns and start-of-pass points are often thin or overlapping, because the header is not full and the speed is changing. A wrong header width, a poor calibration against a weigh wagon, or a moisture sensor that has drifted will scale the whole map, or parts of it.
Cleaned maps set those points aside: the turnaround, the partial swath, the readings that are not physically plausible. What remains is a better picture of the crop and a worse picture of the raw log. People looking at a yield map are usually looking at the cleaned version. The raw points are still the source.
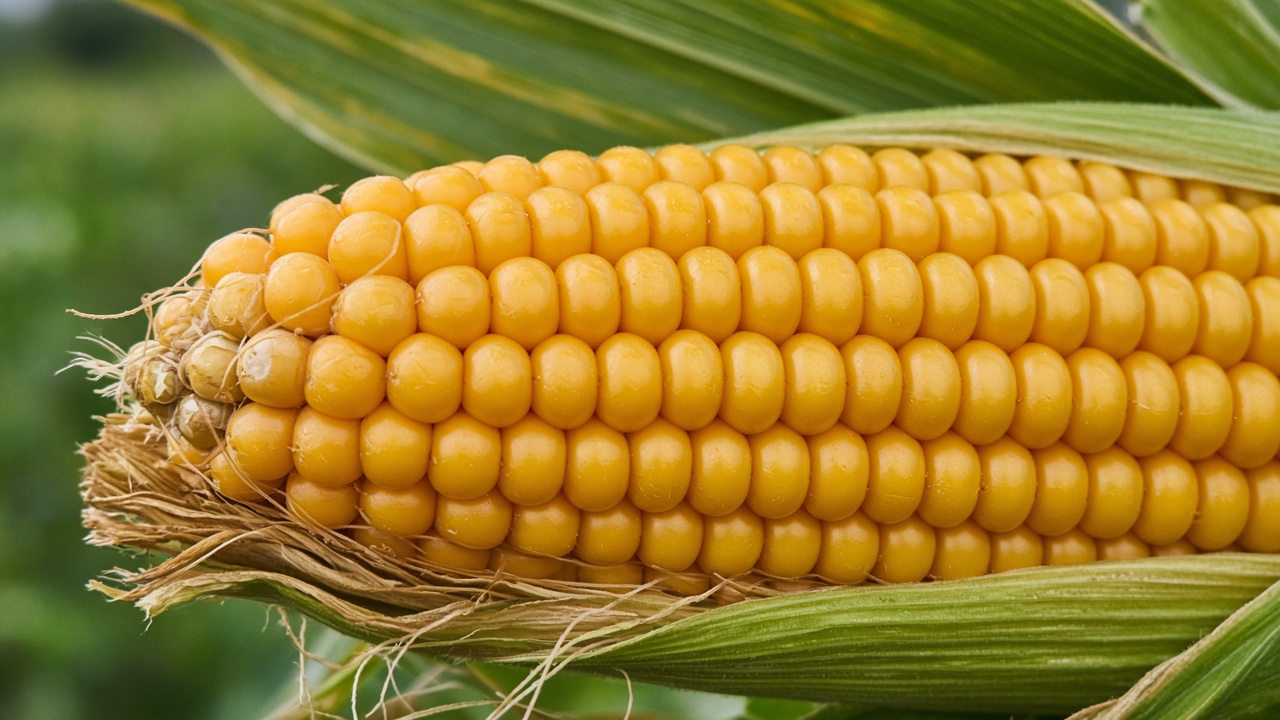
One year and many years
A single year mixes the field's standing pattern with that year's weather. A wet spring can make the low ground the poor ground. A dry August can make it the best. Hail, a drowned-out patch, or a hybrid change can dominate one map and vanish the next. Stacking several years, and looking at which acres are often high or often low, separates the stable pattern from the one-season event.
That stable pattern is why yield maps are used as one input when someone draws management zones or a prescription. The map is a record of what the field did. It is not a soil test, and it does not name the cause. A low yield on a hill might be thin soil, or it might be that the rain missed. Other layers, such as soil and slope, are how people tell those apart.
What a monitor does not cover
Silage, hay, and crops without a yield monitor never produce this file. A field that was custom harvested may have no map even when the grain was weighed at the elevator. The elevator weight is a single number for the field. The yield map is the same crop broken into places. Where the monitor was never on, that breakdown does not exist, and other layers are what remain.