

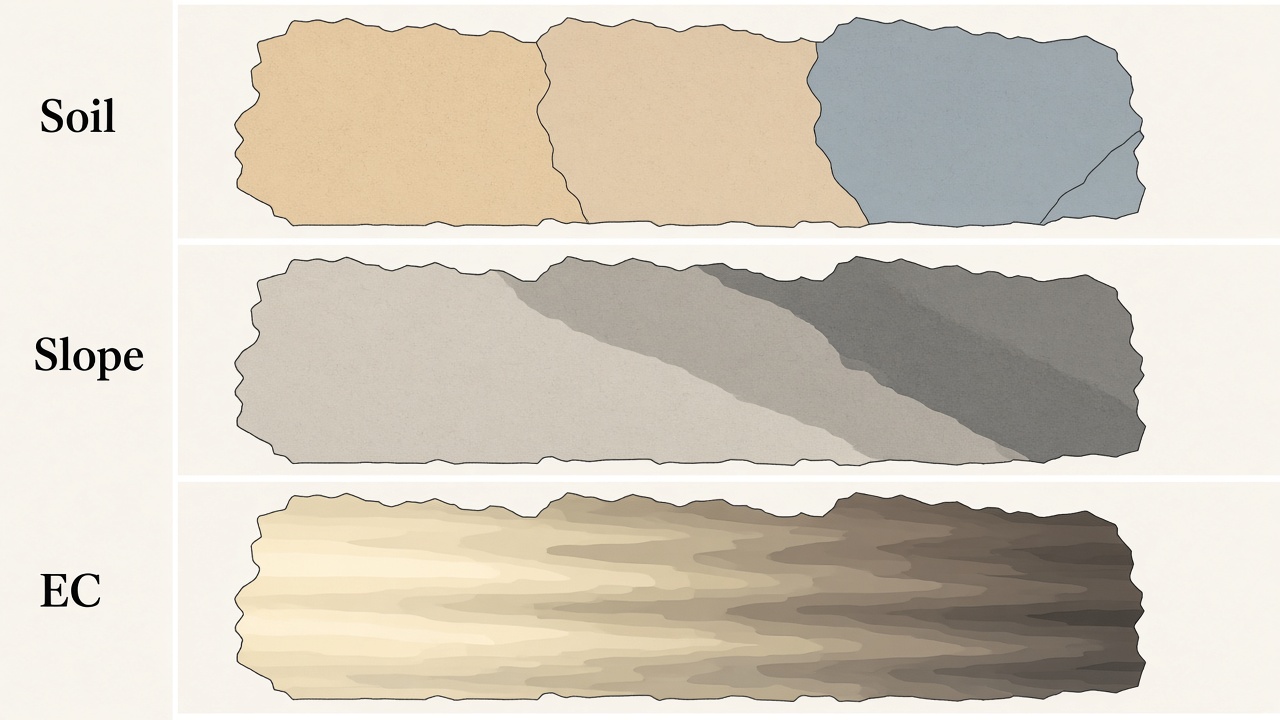
Three maps describe the ground itself, without waiting for a crop to grow on it. A soil survey names the soils a mapper found. A slope map measures the shape of the surface. An electrical-conductivity map measures how well the soil carries an electrical current, which moves with texture, water, and salts. Each one is a picture of why a field is not one acre repeated. None of them is a nutrient test.
Soil surveys
In the United States the detailed survey is SSURGO, the Soil Survey Geographic Database, published by the Natural Resources Conservation Service. A mapper walked the land, bored holes, and drew map units: areas labeled with one or more named soils. A unit often names a dominant soil and soils that occur with it, so a single polygon is not a promise that every foot inside it is the same series.
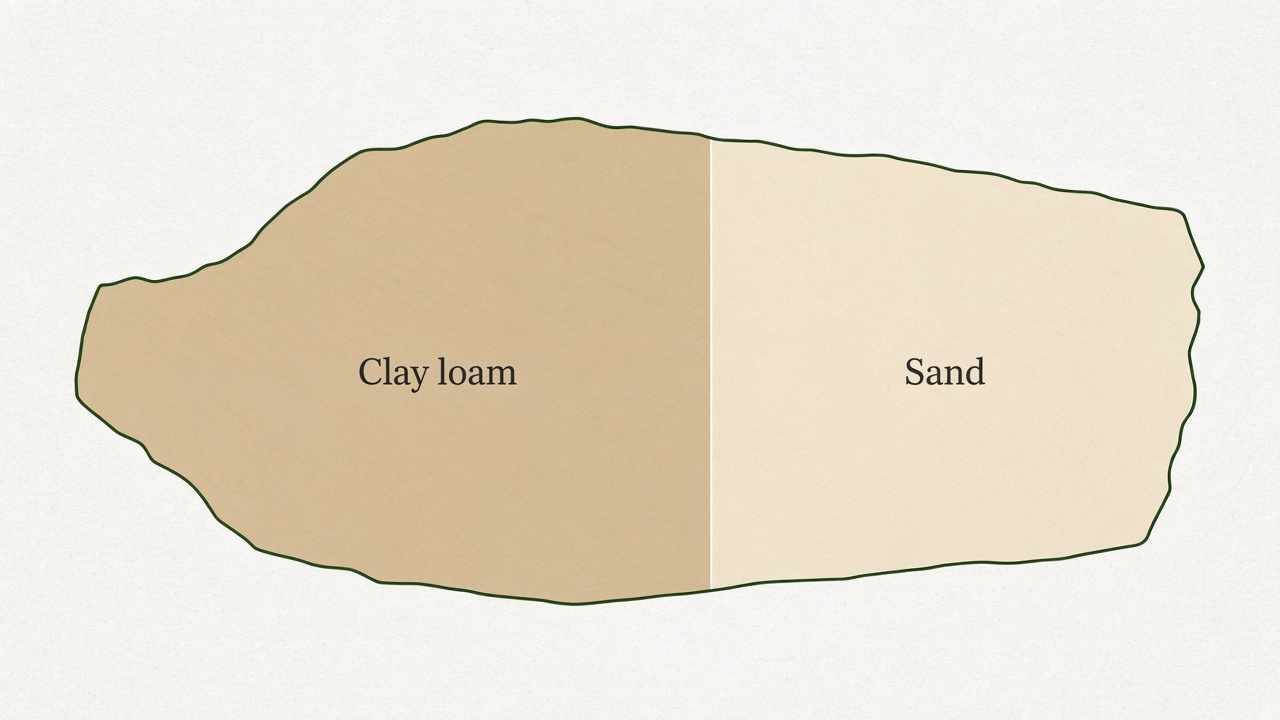
The maps were drawn for planning at the scale of fields and landscapes, commonly around 1:12,000 to 1:24,000. They are reliable for the broad pattern, including a sandy outwash next to a clay till, and they are coarse for a decision on one acre. The published tables still carry useful properties for each named soil: texture class, drainage, slope range, and the depth of restrictive layers. Those properties come from the survey, not from a lab sample taken last fall.
Slope
Slope is derived from elevation. A digital elevation model, such as the USGS 3DEP elevation grids, stores a height for each cell. The difference in height between neighbors is the slope. Aspect, the compass direction the slope faces, comes from the same surface. A hillshade is just that surface lit from one direction so the eye can see the ridges and the swales.
Slope maps are finer than most soil surveys. They show the knob, the sidehill, and the toe slope inside a single soil map unit. Water, erosion, and how fast the ground warms in spring follow those shapes. The elevation grid does not know the soil. A steep cell and a flat cell can share a map-unit name and still farm differently.
Electrical conductivity
Apparent electrical conductivity, written ECa, is measured in the field with a cart or a sled. Coulter systems, such as the Veris mapper, put electrodes in the soil and read the current. Electromagnetic instruments, such as the EM38, induce a current without coulters. Clay, moisture, and dissolved salts all raise the reading. Sand and dry soil lower it. The number is not phosphorus or potassium. It is a continuous trace of how the soil conducts, and that trace often follows texture.
Because the instrument drives every pass, the map is dense, down to the width of the swath. It will also rise in a wet streak and over a saline spot, so a high reading is not automatically "more clay." People compare it with the soil survey and with cores before they treat a conductivity zone as a texture zone. Those zones are one of the layers used to draw management zones and to place a soil sample that stands for the ground around it.