

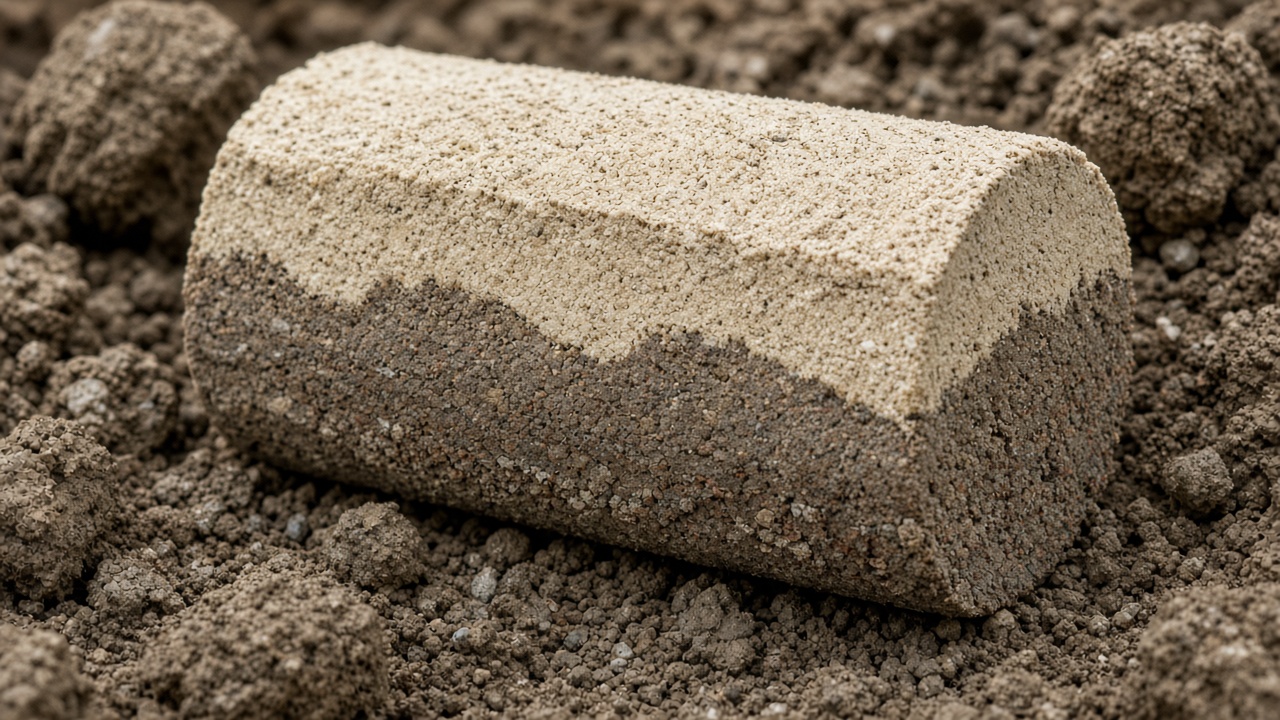
Soil sampling for a map has to decide where the cores go. Two patterns cover most of the work in row-crop fields. Grid sampling puts the cores on a regular lattice. Zone sampling puts them inside management zones. In both cases the lab receives mixed soil, not a map. The map is built afterward by tying each lab result back to the place it came from.
Grid sampling
A grid divides the field into cells of equal area. A common spacing in the central United States is one sample for every 2.5 acres, though wider and tighter grids are both used. The core, or a small cluster of cores, is taken at a point in the cell. That point may be the center, or it may be a spot chosen inside the cell the same way every time.
Each sample is a composite: several cores from around the point, mixed, so one odd clod does not decide the result. The lab reports nutrients, pH, organic matter, and whatever else was ordered, for that cell. Software then fills the field by assigning each result to its cell, or by smoothing between the points.
The grid does not look at the soil before it places a point. A cell can straddle a sand ridge and a clay swale and still produce one number, which is the mixture. Tighter cells reduce that mixing and multiply the cost, because every cell is a lab sample. A grid is also easy to repeat. The same points can be sampled again years later.
Zone sampling
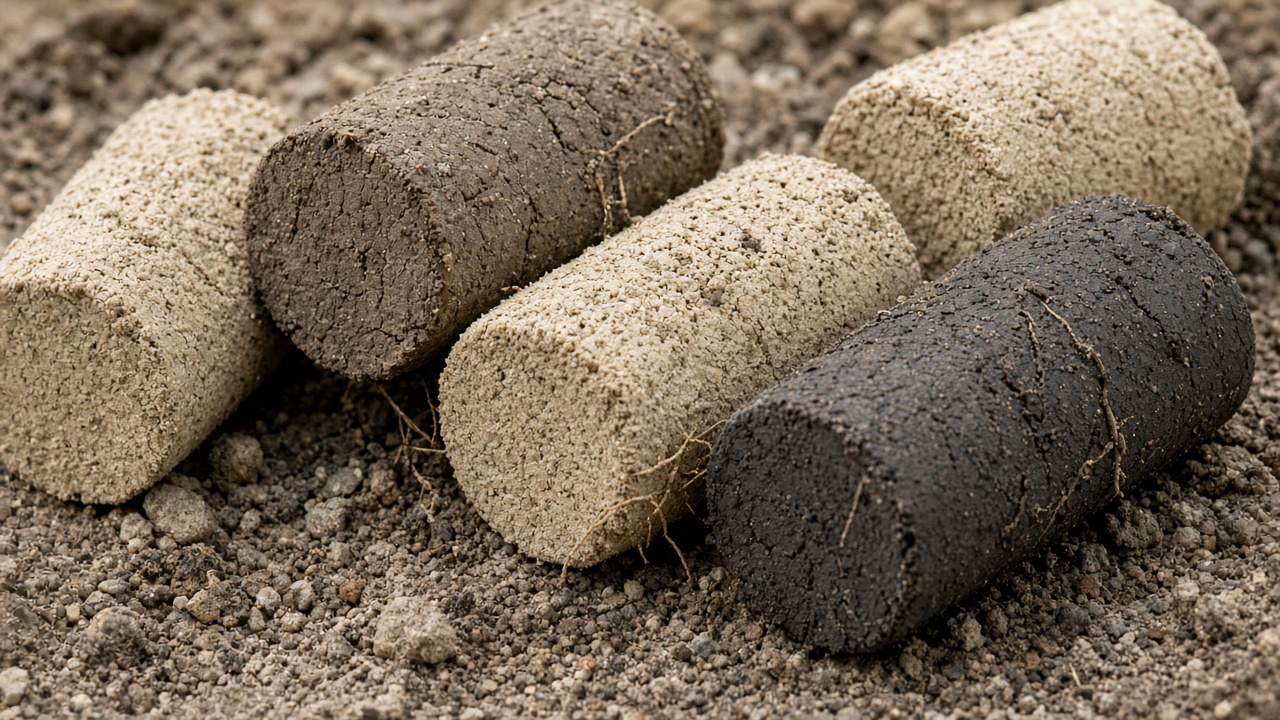
Zone sampling starts from regions that were already drawn, from yield, soil, slope, imagery, or the grower's knowledge of the field. Inside each zone, cores are taken across the area and mixed into one sample. The lab returns one result per zone. The assumption is that the zone is even enough for one result to stand for it.
Fewer zones mean fewer samples than a 2.5-acre grid on the same field. The sample says nothing about differences inside the zone. If the zone line was drawn in the wrong place, the composite blends two kinds of ground and the result describes neither of them well. A zone map is only as sharp as the partition it was built on.
What the lab result is
Either pattern produces a table of places and lab values. Phosphorus, potassium, pH, and buffer pH are the values most often joined to a fertilizer or lime prescription. The result is a concentration in the sampled depth, not a rate. Turning it into pounds of product is a separate step, done from that concentration or from a rate someone has already chosen for it.
Lime prescriptions are often built directly on a pH grid or on zone pH, because pH can swing widely inside one field. Nutrient maps from the same cores can be used the same way, or the zones can be kept and the grid used only where a closer look is wanted. The sampling pattern and the application pattern do not have to match. A grid of soil tests can be averaged up to zones, and a zone sample cannot be split back into a grid it never measured.